

As a nation renowned for its immigrant heritage, the United States of America (U.S.) has historically embraced an open-door policy, albeit with numerous regulations, which has proven immensely advantageous due to the contributions of its immigrant population. None of these diverse communities have thrived more than the Asian American population.
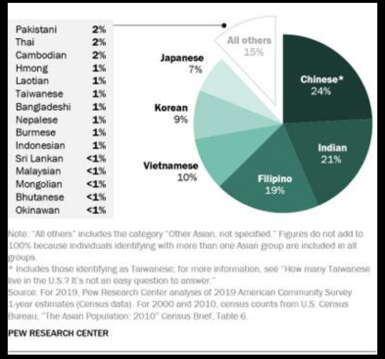
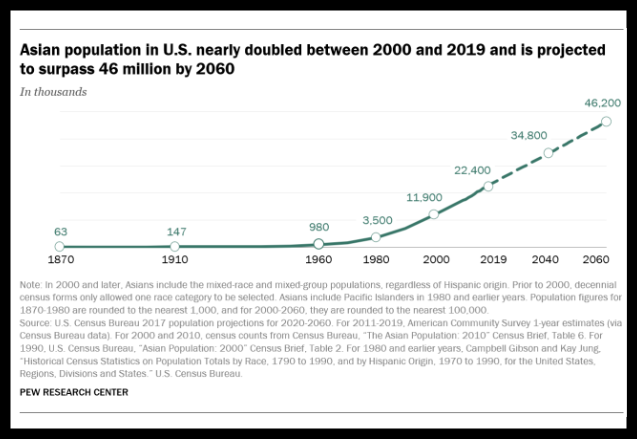
The Asian American population is diverse, with 22 million residing there. This diverse diaspora can trace its roots to over 20 countries across the vast Asian landscape, from East and Southeast Asia to the Indian subcontinent, each telling its own stories and histories, customs and traditions, languages and styles, and many other characteristics.
The Asian American Population Comprises Six Distinct Origin Groups
Where Do Most Asian Americans Live?
Most Asian immigrants that have entered the country have come in legally with due process, while almost a quarter are unauthorized. By 2050, Asian Americans will be the largest immigrant group in the U.S. In 2018, a study by the Pew Research Center, the top country of origin for new immigrants coming into the U.S. was:
- China- 149,000 people
- India- 129,000 people
- Mexico- 120,000 people
- Philippines- 46,000 people
As one of the fastest-growing communities in the U.S., Asian Americans are the highest-paid and best-educated community in the country. Moreover, they are the most satisfied compared to the public with their lives, finances, and where the country is headed. But even more importantly, marriage, parenthood, hard work, and a promising career are common and essential for all Asian communities.
Inheriting such values has ensured the community has one of the lowest poverty rates. In addition, more than half of Asian Americans aged 25 or above have a bachelor’s degree or more. It is remarkable, especially compared to 33% of the U.S. population in the same age range.
For media planners and directors, all of this indicates a community rooted in their culture but embraces what it means to be American while taking advantage of the many opportunities provided to them. So, to understand the Asian community residing in the USA, let’s learn more about them.
Famous Asian Americans
Here are some of the famous Asian Americans:- Manjul Bhargava- Mathematician
- Ocean Vuong- Writer, Poet, Professor
- Rina Banerjee- Artist
- Shuji Nakamura- 2014 Nobel Laureate in Physics
- Lulu Antariksa- Actress
Why Asians Prefer Immigrating to the U.S.?
As a nation built on immigrants, the U.S. has a long tradition of welcoming communities in its country. Apart from living the ‘American Dream,’ most people see the U.S. as a land of aspirations, claiming some of the world’s most influential universities and better working conditions while an opportunity to choose one’s destiny, political stability, more accessible society, and a chance to reunite with families.
Since the colonial era, the U.S. has experienced significant waves of immigration from the early 19th century. They immigrated to America either seeking religious freedom or more incredible economic opportunity. And over the years, the tradition of encouraging outsiders to be a part of the country has continued.
The U.S. may increase its issue of Green Cards to 10.5 million by 2025, a drastic shift in policy from allowing only 1 million immigrants per year. This decision is due to a change in the wage and employment structure, which could see an increase in middle and low-skilled workers. According to researchers at George Mason University in a study commissioned by FWD, the country should raise the number of immigrants to be competitive and expand its future workforce.
The simple truth is that immigrants are expected to drive future growth in the U.S. working-age population; as Baby Boomers head into retirement, immigrants and their children will offset a working-age decline by adding nearly 18 million people between 2015 and 2035. And Asian Americans are likely to lead this growth.
By 2055, the Asian American community will be the U.S.’s largest immigrant group. Pew Research Center estimates that in 2065, immigrants who identify as:
• Asians- 38%
• Hispanics- 31%
• Whites- 20%
• Blacks- 9%.
Apart from most popular skilled jobs, they have also integrated themselves well into the fabric of American society, with 72% of all U.S. Asians being “proficient” in English. However, one-third of its Asians (34%) speak only English in their homes, and the remaining is likely to speak in Chinese, including Mandarin and Cantonese; 34% use Hindi; 9% are comfortable speaking Filipino, and 7% use Vietnamese for communication.
Today, nearly half of Asian Americans live in the West, with almost a third residing in California alone, having an Asian population of roughly 6.7 million, the largest in the country, followed by New York with 1.9 million, Texas with 1.6 million, New Jersey with 958,000 and Washington with 8,52,000.

The largest self-reported Asian origin groups in the U.S. are Chinese Americans, Indian Americans, Filipino Americans, Vietnamese Americans, and Korean Americans.
So, let’s look at them further.Different Demographics of Asian Americans
1. Chinese Americans
As the largest of the Asian-origin groups in the U.S., with 5.1 million people residing across the U.S., Chinese Americans have a long immigration history.
Eager to escape China’s economic and political chaos, Chinese immigrants first flocked in the 1850s to the U.S. They quickly found employment in labor incentive professions like farmhands, gardeners, laundry workers, and most notably, railroad workers.Today, Chinese Americans have integrated themselves well within the American fabric, and just like most Asian communities, they are better educated and are a growing source of skilled and highly skilled workers.
Behavior Of Chinese Americans
Chinese Americans are ideal immigrants in many ways, but their immigration history is layered with discrimination.
In 1886, as anti-Chinese sentiment, immigration abruptly ended through the passage of the Chinese Exclusion Act.However, after the Immigration and Nationality Act of 1965, the U.S.’s restriction on Asian immigration was repealed, paving the way for a new type of immigrant, highly select and well-educated Chinese.
It has seen Chinese Americans attain high education rates, with 57% completing a degree or more.Today, along with Japanese Americans, they are among the highest Asian minority in the legal and financial service fraternity. In addition, Chinese Americans are well-represented in computers, science, and engineering.
Income Levels of Chinese Americans
Chinese Americans had an annual income of $82,000 in 2019, higher than the $61,800 among all U.S. households. Moreover, they also have one of the highest homeownership rates at 63%.
Metropolitan areas with the Maximum Chinese American population
| City | Chinese population |
|---|---|
| New York | 865,000 |
| Los Angeles | 678,000 |
| San Francisco | 582,000 |
| San Jose, CA | 239,000 |
| Boston | 174,000 |
| Seattle | 166,000 |
| Washington | 135,000 |
| Chicago | 135,000 |
| Honolulu | 117,000 |
| Houston | 111,000 |
2. Indian Americans
The Indian American immigrant is a blend of recent arrivals and long-term residents, comprising 21% of the Asian American community. While most are foreign-born, some people were born and raised in the U.S. Most Indian Americans are recent arrivals, with 87.2% being foreign-born. It has been reflected in the percentage of citizenship among Indian Americans, with only 56.2% of citizens.
Through their journey, they bought along their identities rooted in their traditional beliefs. It is exhibited through high levels of marriage within their community.Behavior Of Indian Americans
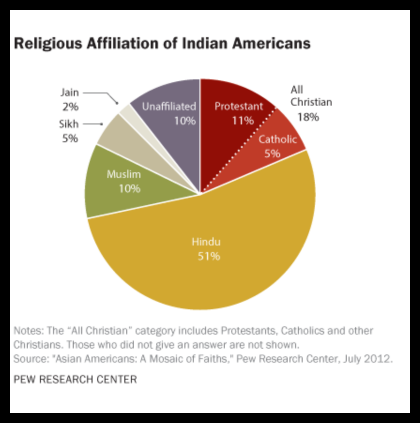
Indian Americans boost having one of the most diverse Asian American communities. For instance, about half (51%) identify themselves as Hindus, while 18% say they are Christians, and 10% say they are Muslim. The religious share is noticeably different in India, where 79.5% are Hindus, 14.2% are Muslims, and 2.3% are Christians, showcasing differential migration patterns.
For most Indian Americans, religion plays a significant role in their lives, though religious practices are less pronounced. Nearly half of all Hindu Indian Americans identify with a caste group. Yet, tellingly, U.S.-born Indian Americans are less likely to adopt a caste identity, displaying a shift in cultural priorities.
More than any other Asian-origin group, Indian Americans are likely to have, at the very least, a bachelor’s degree or more. Many already hold a bachelor’s degree before arriving in the U.S. with visas for high-skilled workers. In fact, since 2001, half of H-1B visas have gone to Indians, and nearly half have got it through employer sponsorship.
The consensus seems that when it comes to occupational attainment, Indian Americans have attained the most prestigious jobs. They are likely to take up executive and senior management roles and have the highest proportion in computer, science, and engineering at 23.8%.
Income Levels Of Indian Americans
With most Indian Americans attracting high-paying jobs, they have an annual income of $190,000, the highest among Asian American. So it is no surprise they also have one of the highest homeownership rates at 56%.
Metropolitan areas with The Maximum Indian American population
| Metro area | Indian population |
|---|---|
| New York | 711,000 |
| Chicago | 238,000 |
| San Francisco | 234,000 |
| Dallas | 208,000 |
| Washington | 192,000 |
| San Jose, CA | 189,000 |
| Los Angeles | 171,000 |
| Houston | 161,000 |
| Atlanta | 137,000 |
| Philadelphia | 137,000 |
3. Filipino Americans
After the U.S. acquired the Philippines in the Spanish-American War of 1898, Filipino immigration began into the U.S. Many immigrants started working on plantations in Hawaii before eventually reaching the U.S. mainland. Today, with roughly 47,500 Filipinos migrating to the U.S. every year, Filipino Americans are the third-largest Asian American community in the country. And unlike any other immigrant group, Filipino Americans have strong English skills and high college education rates.
The behavior of Filipino Americans
With Philippine Commonwealth being established in 1935, the Philippines would have to go through a 10-year transitionary period for independence. After that, they would essentially be U.S. citizens but not afforded the same benefits, rights, and privileges as U.S. citizens.
Today, things are very different, with more rights and privileges available for immigrants. Most Filipinos have obtained lawful permanent residence through family reunification, family-sponsored channels, or employment preference, with the highest number likely to be in the medical and healthcare field. For example, after the U.S.’s recruitment drive for nurses in the 1950s, which continues even today, there has been a wave of immigration, with 19,000 nurses migrating yearly.
Nearly half of Filipinos (52%) will likely send remittances back home. And with the Citizenship Retention and Re-Acquisition Act of 2003, which allowed Filipino Americans to apply for dual citizenship in the U.S. and the Philippines, Filipino Americans have been allowed to participate in elections, purchase land and retire in the Philippines.
Income Levels of Filipino Americans
Most Filipino Americans are a part of the medical fraternity, meaning they have higher incomes. Filipinos earn around $90,400, exceeding the median for Asian Americans overall. They also have one of the highest homeownership rates at 62%.
Metropolitan Areas with Maximum Filipino American Population
| Metro area | Filipino population |
|---|---|
| Los Angeles | 506,000 |
| San Francisco | 310,000 |
| New York | 236,000 |
| Honolulu | 214,000 |
| San Diego | 201,000 |
| Las Vegas | 147,000 |
| Chicago | 145,000 |
| Riverside-San Bernardino, CA | 136,000 |
| Seattle | 115,000 |
| San Jose, CA | 109,000 |
4. Vietnamese Americans
In 1975, when 125,000 Vietnamese refugees entered the U.S., the U.S. government conducted the most dramatic evacuation, matched only recently by the chaos in Afghanistan after the U.S. military’s withdrawal. Subsequently, more refugees and their families would enter, roughly doubling between 1980 and 2000. Today, they represent one of the largest Asian communities.
Behavior Of Vietnamese Americans
Most Vietnamese that arrived in the U.S. were less educated and needed more skills, primarily due to rampant poverty, stringent government controls, and severe food shortages. Unfortunately, this trend continues, with 31% of 18+ immigrants speaking English proficiently, and only 23% have completed some degree.
What is noticeable among Vietnamese Americans is that unlike other Asian American groups, where many return to their country of origin, nearly all Vietnamese American intend to stay in the U.S. permanently.
For most Vietnamese Americans, family is essential, with 61% believing a successful marriage is a priority. And this is also mirrored in their approach to community. For example, even though most are not financially well-off, they are most likely to send money to someone in Vietnam.
Income Levels of Vietnamese Americans
Even though most Vietnamese Americans don’t have a degree or acquired skills, they tend to have higher incomes, are less likely to be in poverty, and are more likely to be insured. In addition, most have found employment in skilled blue-collar work, with 33% employed in service occupations and 32% in management, business, science, and arts occupations. In addition, Vietnamese Americans have the highest homeownership rate among Asian Americans (67%).
Metropolitan areas with the Maximum Vietnamese American population
| Metro area | Vietnamese population |
|---|---|
| Los Angeles | 346,000 |
| Houston | 143,000 |
| San Jose, CA | 143,000 |
| Dallas | 96,000 |
| San Francisco | 84,000 |
| Seattle | 74,000 |
| Washington | 69,000 |
| San Diego | 58,000 |
| Atlanta | 55,000 |
| Sacramento, CA | 42,000 |
5. Korean Americans
After the Korean War, more than 6,000 Korean women came to the U.S. as wives or fiancées of U.S. service members. However, the flow of immigrants coming to the U.S. began only after 1965, when the Immigration and Nationality Act of 1965 was in place to allow immigrants from all countries. It was driven by advanced political, economic, and military relations between the two nations seeing a considerable increase in Vietnamese Americans in the following years.
Today, the U.S. is home to the largest South Korean population in the world.The behavior of Korean Americans
In the initial wave, Koreans that entered the U.S. were mostly low-skilled agricultural workers. However, today’s recent arrivals are highly educated and earn higher incomes. As a result, South Korea has the third largest number of international students in the U.S., after China and India.
More than half of Korean Americans are employed in management, science, business, and arts occupations. That is why most Korean Americans have gained lawful permanent resident status through sponsorship from an employer or immediate relative, as their jobs are highly skilled.
Income Levels of Korean Americans
Surprisingly, despite Korean Americans having one of the highest citizenship rates, they are the least likely to own a home. Between 2015 and 2019, Korean households earned less than $50,000. However, today their household income is at $72,000.
Metropolitan areas with The Maximum Korean American Population
| Metro area | Korean population |
|---|---|
| Los Angeles | 326,000 |
| New York | 220,000 |
| Washington | 96,000 |
| Seattle | 67,000 |
| Chicago | 62,000 |
| San Francisco | 60,000 |
| Atlanta | 51,000 |
| Philadelphia | 42,000 |
| Dallas | 41,000 |
| San Jose, CA | 36,000 |
The Asian American community is nearly 22 million in the U.S., and learning how these communities function can go a long way in catering to a vast and diverse audience.
Streamlyn specializes in multicultural marketing, helping advertising agencies in the U.S. and Canada plan and execute campaigns targeted at Asian communities in America. To learn more about the Asian experience through data, you can reach us by clicking the below contact button.