

Canada has one of the world’s most attractive immigration policies, which includes job vacancies, education, political stability, and universal healthcare. Therefore, it is not surprising that immigrants across the globe choose to relocate to Canada.
The Great White North has a long history of immigration, dating back to 1788, with the first set of Chinese settlers arriving to help build a trading post and encourage trade between the two nations.
Just like its neighbor, the United States of America, the foundation of Canada’s multicultural identity is defined by its immigrants. And over the years, the tradition of encouraging outsiders to be a part of the country has continued.
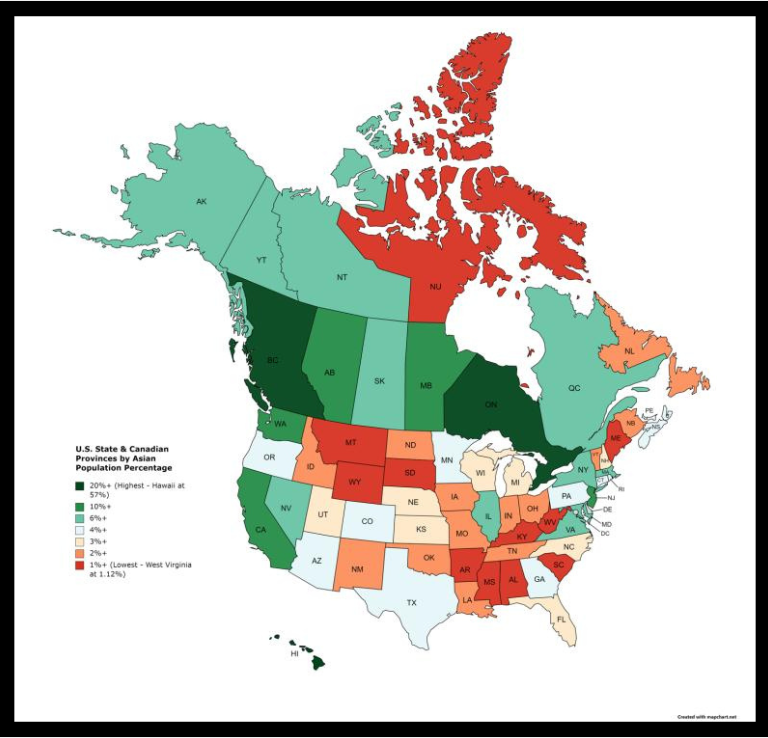
What percentage of Canadians are Asian?
In 2016, 6,095,235 people in Canada had Asian origins, representing 17.7% of Canada’s population.
The major pan-ethnic origin groups in Canada are divided into:
European (52.5%), North American (22.9%), Asian (19.3%), North American Indigenous (6.1%), African (3.8%), Latin, Central and South American (2.5%), Caribbean (2.1%), Oceanian (0.3%), and Other (6%).
Where to Find Asian Canadians?
The largest South Asian Canadian communities are found in the areas of Ontario, British Columbia, and Alberta, while metropolitan areas with large populations include Toronto (1,182,485), Vancouver (369,295), Calgary (153,200), Edmonton (123,340), and Montréal (121,260).
In the Great White North, the Canadian Asian community remains the most significant visible minority, representing 15% of Canada’s population, carving out a space for themselves within the community.
Moreover, they have created sub-communities connected to other immigrants within these provinces. According to a recent Statistics Canada study, the immigration numbers have risen, and more households now speak languages other than English and French at home. It was primarily seen among the South Asian communities, with the languages most spoken among them being.
- Malayalam (+129% to 35,000 people)
- Hindi (+66% to 92,000 people)
- Punjabi (+49% to 520,000)
- Gujarati (+43% to 92,000).
What this means for media planners and directors is a community rooted in their culture while embracing what it means to be Canadian. So, to understand the Asian community residing in Canada, let’s learn more about them.
How has the Asian Canadian Community grown?
By 2025, as indicated by its Immigration Levels Plan for 2023-2025, the country is expected to welcome nearly 500,000 newcomers, the most ever welcomed in a single year.
And if Statistics Canada population projections are to go by, then by 2036, immigrants born in Asia could represent between 55.7% and 57.9% of all Canadian immigrants.
This bodes well for the country, as it faces historic labor shortages with nearly 1 million job vacancies available, an 80% increase since pre-pandemic. With an aging population, labor shortages (especially in sectors like healthcare and social assistance), and the COVID-19 pandemic, Canada has turned to immigration.
Moreover, Asian immigrant children are more likely to obtain a postsecondary certificate, diploma, or degree than previous-generation immigrants. It gives them a higher chance to land jobs that require specific skills.
| Ethnicity | Population in Canada |
| Chinese Canadians | 1715770 |
| Indian Canadians | 1347715 |
| Filipino Canadians | 957355 |
| Korean Canadians | 218140 |
| Vietnamese Canadians | 275530 |
Source: Statistic Canada
The Asian Canadian community, which is considered a visible minority, is characterized as:
- South Asian Canadians (2,571,400 persons or 35.1%)
- East Asian Canadians (2,289,805 persons or 31.2%)
- Southeast Asian Canadians (1,434,330 persons or 19.6%)
| South Asian Canadians | Southeast Asian Canadians | East Asian Canadians |
| India Pakistan Bangladesh Nepal Sri Lanka Bhutan Maldives | China and Hong Kong, Japan, South Korea, North Korea, Mongolia, Taiwan, Tibetan | China and Hong Kong, Japan, South Korea, North Korea Mongolia, Taiwan, Tibetan |
Deemed the fastest and largest growing ethnicity in Canada, Asian Canadians primarily live in cities, with the largest self-reported Asian origin groups in Canada being Chinese Canadians, Indo-Canadians, Filipino Canadians, Vietnamese Canadians, and Korean Canadians. So, let’s look at them further.
Different Demographics of Asian Canadians
- Chinese Canadians
Chinese Canadians have been a part of Canadian culture since the 18th century. They initially arrived as manual laborers, helping build ports and train tracks. Today’s Chinese immigrants comprise 4.6% of the Canadian population, are better educated, and are a growing source of skilled and highly-skilled workers.
The behavior of Chinese Canadians
Most Chinese immigrants in China aspire to build a better life for the next generation. For this reason, most second-generation Chinese Canadians have completed a university degree. In 2016, 72.6% of second-generation Chinese Canadian women completed a university degree.
Based on the 2018 Canadian Housing Survey, Statistics Canada, 85% of Chinese Canadians reside in a house owned by a household member. On the other hand, half of the Chinese diaspora in Canada were less likely to live in rented accommodation. It would seem like significant progress for the community. However, it is critical as 32% of the houses purchased are deemed “unaffordable.”
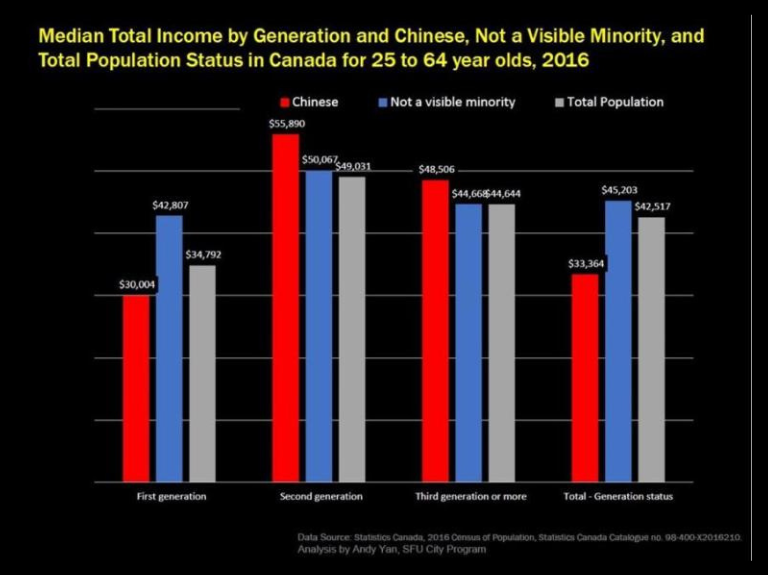
Income Levels of Chinese Canadians
This cautionary tale also seeps into income levels among the first-generation, aged 25-64, where despite high levels of education, they earn just C $ 30,004 yearly. But among second-generation Chinese Canadians, earnings soared to C$55,890 (US$43,788) yearly.
Metropolitan Areas with Maximum Chinese Canadian Population
| Cities | Number of Chinese Canadians |
| Nunavut | 65 |
| Northwest Territories | 335 |
| Yukon | 640 |
| Newfoundland and Labrador | 2005 |
| Prince Edward Island | 3335 |
| New Brunswick | 4085 |
| Nova Scotia | 11600 |
| Saskatchewan | 18010 |
| Manitoba | 25390 |
| Quebec | 115240 |
| Alberta | 164235 |
| British Columbia | 550590 |
| Ontario | 820245 |
Source: Statistic Canada
2. Indian Canadians
As part of the South Asian community, Indian Canadians are the most diverse, as observed by the various languages spoken at home. In addition, India has a rich religious and cultural heritage, and even though Canada boasts similar multiculturalism, the representation of Indian Canadian Sikh or Indian Canadian Christians is much higher in Canada.
Among South Asians, they remain the most significant community, with Indians at 44.3%. In addition, 1 in 5 recent immigrants to Canada was born in India, while 28.7% were born in Canada and 2.1% in Africa.
The behavior of Indian Canadians
With quality education available in the Great White North, there has been a considerable rise in students moving to Canada, with nearly 183,000 Indian students in various universities and almost 450,000 applications being processed last year.
Plus, the number of Indians who have become permanent residents of Canada has climbed significantly, seeing a 105% rise from 2016 to 2019. And the community also has an excellent political representation, with 23 Indo-Canadians elected as MPs in federal elections. Most of those elected have their roots in the Indian province of Punjab.
Metropolitan Areas with Maximum Indian Canadian Population
| Cities | Number of Indian Canadians |
| Nunavut | 90 |
| Northwest Territories | 430 |
| Yukon | 710 |
| Prince Edward Island | 2280 |
| Newfoundland and Labrador | 2765 |
| New Brunswick | 5655 |
| Nova Scotia | 14310 |
| Saskatchewan | 20755 |
| Manitoba | 38825 |
| Quebec | 65790 |
| Alberta | 155700 |
| British Columbia | 275975 |
| Ontario | 764435 |
Source: Statistic Canada
Income Levels of Indian Canadians
For all of its great strides, most Indian migrants are likely to settle for blue-collar jobs, as they lack soft skills or their qualifications don’t match the requirements in Canada. It can mean that integration into the job market is more challenging. Indian Canadians are doing reasonably well overall, with most earning higher than the national average.
3. Filipino Canadians
As the largest group of Southeast Asian Canadians, Filipinos have been the most dynamic ones. Since the 1970s, Filipinos have migrated to Canada due to overpopulation and economic and political difficulties in the Philippines. And by 1972, when martial law was declared, more Filipinos were encouraged to leave to seek better economic opportunities for their families.
The behavior of Filipino Canadians
It has seeped into their approach, and they have often been ranked first as “independent immigrants,” quickly contributing to Canadian society and economy. As a result, the community’s poverty rate of 3.6% in 2020 is below the national average. Moreover, with Filipinos eager to contribute, they are the highest minority in the healthcare sector and social assistance sectors, with 20% of all workers coming from the community.
Another vital point about Filipino Canadians is that women outnumber men by 56% to 44 %.
| Cities | Number of Filipino Canadians |
| Nunavut | 315 |
| Northwest Territories | 1665 |
| Prince Edward Island | 1760 |
| Yukon | 1945 |
| Newfoundland and Labrador | 2270 |
| New Brunswick | 5190 |
| Nova Scotia | 6615 |
| Saskatchewan | 43755 |
| Quebec | 44885 |
| Manitoba | 94315 |
| British Columbia | 174280 |
| Alberta | 216710 |
| Ontario | 363650 |
Source: Statistic Canada
Income Levels of Filipino Canadians
Yet, of their dynamic nature, they still face a tremendous wage gap compared to other communities. For example, Filipino men have a much lower unemployment rate but still earn comparatively less. On the other hand, Filipino women also had lower unemployment rates, but the wage gap was smaller.
4. Vietnamese Canadians
Since the 1960s, citizens of Vietnam have been entering Canada to complete academic scholarship programs. At the time, most came to Quebec, owing to their background in the French language.
The behavior of Vietnamese Canadians
While most Vietnamese returned home after completing their studies, some remained to become permanent residents. However, after 1975 the Vietnam War ended, the Vietnamese sought shelter in Canada. As a result, by 1985, approximately 110,000 Vietnamese refugees had settled in Canada. Since then, they have easily integrated well into Canadian society.
Income Levels of Vietnamese Canadians
Most Vietnamese Canadians are recent migrants to Canada, and most are first-generation Canadians, with less than two out of five being born in Canada. And yet, they can thrive in manufacturing and scientific and technical sectors. In 2011, Québec’s Ministry of Immigration and Cultural Communities report stated that
- 29.2% in sales and services
- 15.1% in business, finance, and administration
- 13.3% in natural and applied sciences
- 11.3% in the health sector
The community has the same employment rate as compared to the average Canadian. However, their incomes are comparatively lower.
| Cities | Number of Vietnamese Canadians |
| Nunavut | 0 |
| Yukon | 90 |
| Newfoundland and Labrador | 175 |
| Northwest Territories | 255 |
| Prince Edward Island | 730 |
| New Brunswick | 1295 |
| Nova Scotia | 1375 |
| Saskatchewan | 4730 |
| Manitoba | 7290 |
| Alberta | 39395 |
| Quebec | 45570 |
| British Columbia | 51890 |
| Ontario | 122735 |
Source: Statistic Canada
5. Korean Canadians
Through Christian missionaries in Korea, Canadians first came in contact with Koreans in 1890. Fast forward to 1969, and an estimated 2,000 Koreans were in the Great White North. By the 1990s, Korean Canadians would be Canada’s fifth-largest immigrant community; as of 2013, there were 205,993 Korean Canadians.
The Behavior of Korean Canadians
In Canada, many are witnessing second-generation Korean migrants developing a dual identity. Also, intercultural marriages by second-generation Korean immigrants and increasing demand for learning English by Koreans have made Korean Canadians feel more accepted.
| Cities | Number of Korean Canadians |
| Nunavut | 10 |
| Northwest Territories | 75 |
| Yukon | 85 |
| Prince Edward Island | 120 |
| Newfoundland and Labrador | 220 |
| New Brunswick | 1655 |
| Saskatchewan | 1850 |
| Nova Scotia | 2845 |
| Manitoba | 4325 |
| Quebec | 10360 |
| Alberta | 24365 |
| British Columbia | 72815 |
| Ontario | 99425 |
Source: Statistic Canada
Most Korean Canadians have cultivated their identity through local cultural associations, university alums and professional groups, and business and trade associations.
Income Levels of Korean Canadians
In a study conducted by the Canadian Centre for Policy Alternatives, two communities, the Japanese and the Koreans, found variability in income levels. For example, Korean Canadians had an average earning that was 53% of the earnings of non-racialized Canadians.
In the Middle East, Asians represent nearly 20.2% of the Canadian Asian population. Learning how these communities are built can go a long way in catering to a vast and diverse audience.
To learn more about the Asian experience through data, you can reach us by clicking the below contact button.
